
As part of the 2019 update of Indiana’s Multi-Hazard Mitigation Plan, the Polis Center at IUPUI performed a number of spatial analyses to determine the risk of various natural hazards affecting the state.
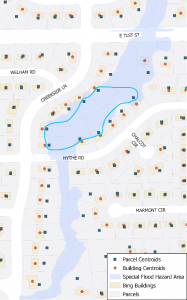
Figure 1: 100-year flood illustration example
For flood, earthquake, and tornado analysis, the Polis Center uses FEMA’s HAZUS-MH software to estimate the impact of these hazards. In order to obtain more accurate results, Polis uses the state’s Real Property Tax Assessment Data provided by the state’s Department of Local Government Finance (DLGF) and available from IndianaMap.
When providing our own assessment data, instead of using out-of-the-box values, the HAZUS software accepts only point locations. In the past, the Polis Center used parcel centroids. However, these often do not represent the locations of structures that would be affected, especially in the case of a 100-year flood (See Figure 1). In June 2018, Bing released building footprints for the United States, including over 3 million structures for Indiana. These structures were created in an automated fashion through the use of machine learning and were released as open data, meaning anyone could use it. Polis staff quickly saw that this dataset could help increase the accuracy of our analysis.
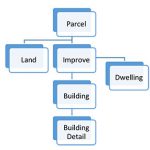 The DLGF data has a hierarchical structure with the PARCEL record as the parent record, followed by LAND and IMPROVE records. Polis needed information from the PARCEL, IMPROVE, DWELLING, and BUILDING tables to provide HAZUS with the information it needs to perform the analysis. This includes square footage of the structure, number of floors, years built, foundation type, and more.
After investigating both Bing’s and DLGF’s datasets, Polis settled on associating DLGF assessor information to the largest building within each parcel. This is because it is not possible, at this time, to associate specific improvement records to individual buildings. While we realize that the largest building will not always be representative, we felt it was the best solution considering the available data and would be an improvement over the use of a parcel’s centroid.
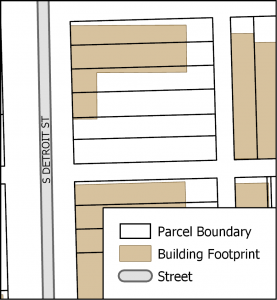
Figure 2: Bing building footprint example
Bing’s building footprints did not always match up with parcel boundaries, so an initial “intersect” of the parcels and buildings was necessary to split up buildings overlapping multiple parcels. For example, in Figure 2, the building overlaps four parcels and a sliver of a fifth. In Google Street View, you can see that in reality, this should be represented as four separate buildings.
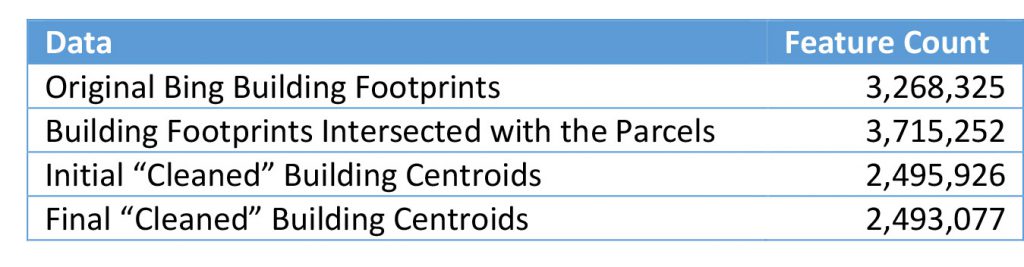
Once the building footprints were intersected with the parcels, their centroid coordinates and area were added as attributes. The data was then loaded into SQL Server Express in order to quickly identify and keep only those largest buildings within a parcel, as it was much easier to perform this query using SQL. The following table provides the building footprint count during the process.
 Once the cleaned building centroids were available, the identifier of the parcel in which each building was located was added as an attribute. This allowed us to extract the necessary DLGF data and associate it with each building point. We then used a combination of 8 FME scripts to massage the data in order to provide HAZUS with a compliant dataset for analysis.
Unfortunately, the data processing was very time-consuming. After a few tests, the statewide data was divided into 37 groupings as we found that this provided not only manageable processing sizes but also provided a more efficient way to QC the resulting data. In order to not spend weeks pushing these 37 data groupings through 8 FME scripts, and to avoid user error, the process was automated. To do so, we determined that each FME script could be called in a command prompt. All that needed to be done was updating the FME script’s path and inputs/outputs. The command prompt syntax is available within FME upon running the tool.
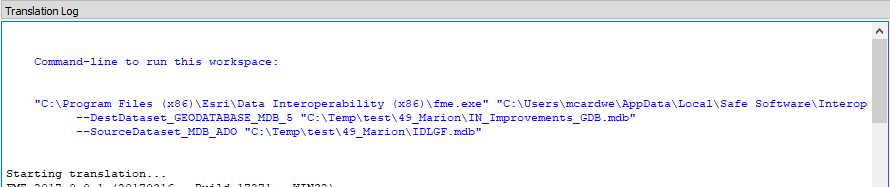
Figure 3: FME script example
Now that the processing was automated, it could be run overnight and during weekends, without requiring our analysts’ precious time. Had we not automated the process as much as we had, it would have taken our team much more time, as well as many nights and weekends, to obtain the data. Overall, we were very happy with the results and hope to make it even better in the future.