Practical applications of data, advanced technology, and analysis to address critical social issues
The global pandemic dominated our attention in 2020 on arriving in the U.S. Polis responded with technology to address the problems it presented, including the racial, social, and economic inequalities. This work, although spurred by the pandemic, was not new to us. COVID-19 inspired Polis to use its information, analytical capabilities, and technology to new ends. We already were engaged in projects that dealt with a number of similarly complex problems, ranging from the addiction crisis, domestic violence, poverty, aging, and disaster mitigation.
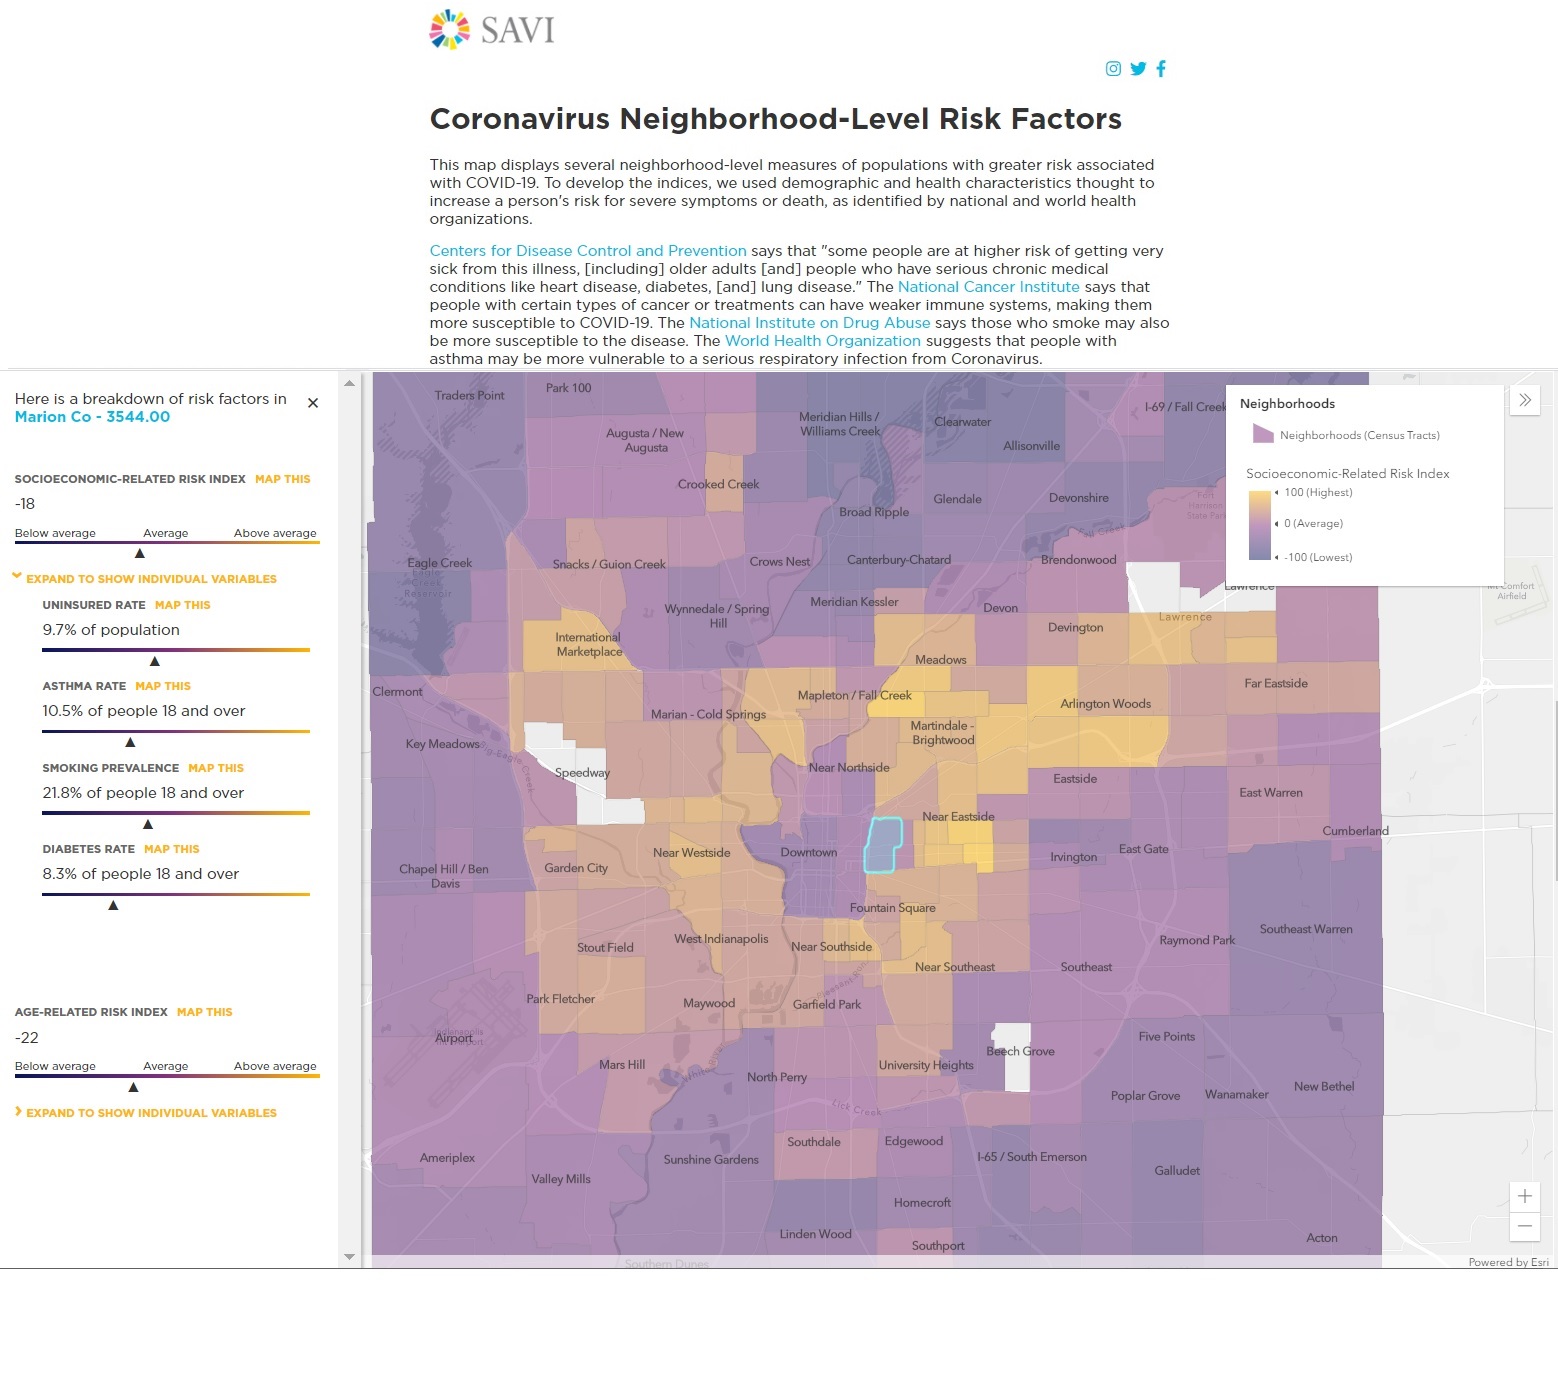
We took the information we had about communities and vulnerable populations and put it one place using innovative technology, creating the SAVI Coronavirus Data Hub so people can access the info they need to make critical decisions quickly. This information hub was the first of its kind early on when little understanding of the crisis was available. Its interactive capabilities make it unique by allowing users to explore detailed, community-specific data to understand the challenges, inequities, and impact of the pandemic.
The hub presents a lot of data in a variety of ways. It features maps, data, dashboards, reports, and articles to help guide decision-making of practitioners and policy makers during the COVID-19 public health crisis.
Hub dashboards track confirmed cases, testing, and deaths for each county in Indiana and trends for U.S. counties. Hub content addresses social isolation in older adults, locations of emergency food/meals and community center service areas, inequalities, disparities for hard-hit or at-risk neighborhoods and populations, neighborhood risk factors in Bloomington and South Bend, COVID-19 impact on Indiana businesses, and needs by neighborhood (2-1-1 calls, unemployment claims, predicted eviction rates, and rental assistance applicants).
The hub tells a story about the impact of the pandemic on our community by putting data into context to help people understand the implications it has on service delivery, showing vulnerable areas where funds should be directed, and how to be forward looking in planning.
The structure of the hub is a creative mashup of technology and information. Polis integrated, analyzed, and published data from the SAVI Community Information System, along with data from government and nonprofit partners using open data portals, APIs, and even data from simple documents and spreadsheets partners provided. We used ESRI operations dashboard templates, story maps, ArcGIS Javascript API, 3D mapping via ArcGIS Scene, and several other GIS and data analytics tools to build a comprehensive information resource about the risk, level, and impact of COVID-19 on communities and residents in Indiana. Such innovation illustrates and underscores the quality of technical and analytical capabilities of local talent. It pushed other organizations to adapt the tools and technology for other uses.
For more information, contact Marc McAleavey.